Market Overview
It is a quiet start to the week on major markets, with a hue of mild risk positivity. Friday’s rather mixed batch of US data has done little to change the outlook and has left traders somewhat betwixt and between for the new trading week. Friday’s jobs report saw better than expected payrolls data but was still not great, whilst wages were also just OK.
A miss in the ISM Manufacturing also leaves the industrial sector under pressure (whilst the terrible Prices Paid component will add to concerns of subdued inflation trends). So the dollar has got little traction out of all of this. However, the latest on the trade dispute is more of the same, slow but seemingly steady progress. Phase One may be signed in the coming weeks, with alternative venues for a summit suggested but nothing confirmed yet. There is a mild risk positive vibe still through markets, with a tick or so higher on yields, whilst the offshore Chinese Yuan also continuing to strengthen against the dollar. Eyes will be on new ECB President Christine Lagarde who gives her first speech in her new role today. Will the emphasis be on fiscal support within the euro area?
Wall Street closed with strong gains on Friday with the S&P 500 +1.0% at 3067 whilst US futures are +0.2% early today. This has helped the Asian session higher with the Shanghai Composite +0.5% (Nikkei closed for public holiday). In Europe there is a continuation of decent gains in early moves, with FTSE futures and DAX futures both around +0.5% higher.
In forex, there is a slightly risk positive bias, with JPY being the main underperformer, whilst USD is also mixed. The commodity currencies are also doing well today with NZD being the main outperformer.
In commodities, there is little real direction for gold or silver, whilst oil is unwinding a shade lower after a strong rebound on Friday.
The early European session is dominated by the final Manufacturing PMIs across the euro area. The Eurozone final Manufacturing PMI is at 09:00 GMT which is expected to be confirmed at 45.7 (45.7 flash, 457 September final). The UK Construction PMI is at 09:30 GMT and is expected to only marginally improve to 44.0 in October (from an extremely weak 43.3 in September).
Chart of the Day – FTSE 100
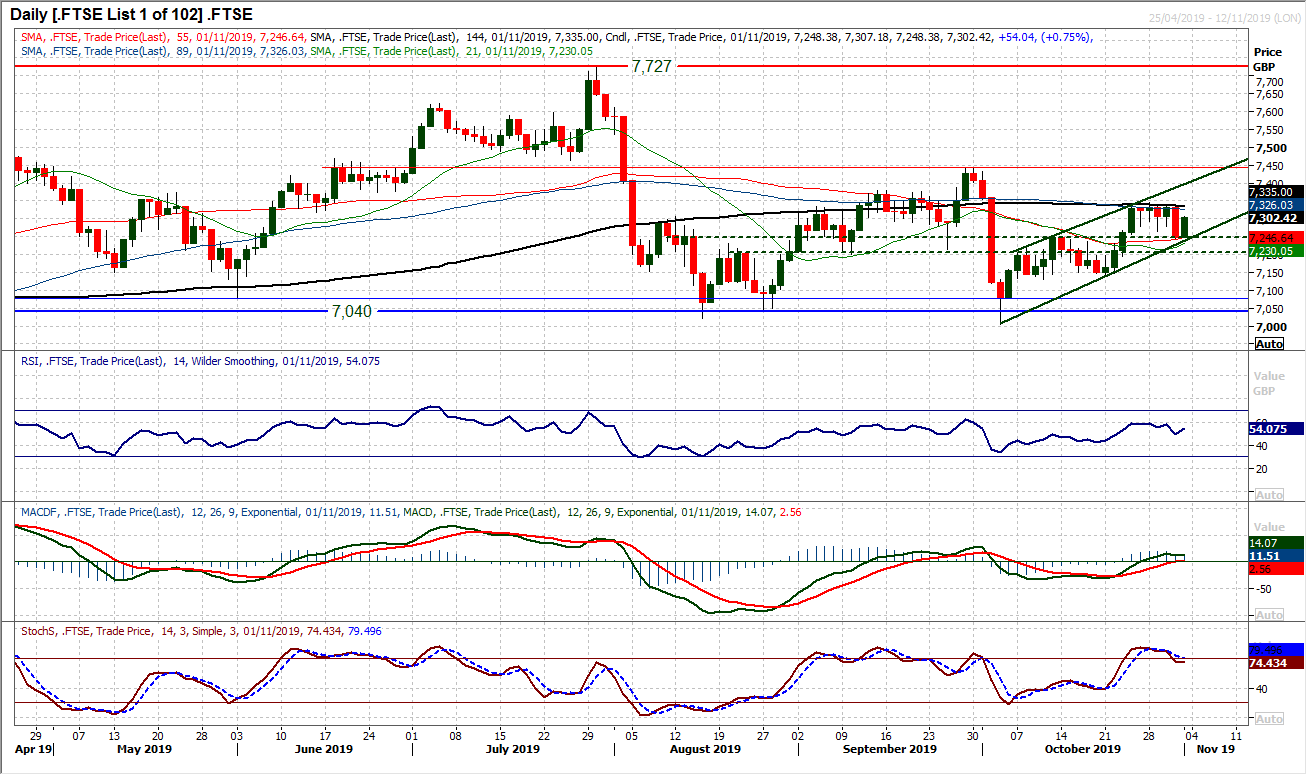
Trading FTSE 100 is like wading through treacle, and is certainly a hard slog. The underperformance of FTSE 100 continues to be a feature against other markets such as the DAX, as the negative correlation with a resurgent GBP plays out. However whilst peer indices test and eye multi-month and multi-year highs, in its own right, the recovery on FTSE 100 is still a work in progress and far from given. For three months, the market has been drudging sideways in a range between key support around 7040 and the failure high of 7440 from September. Within this range, there is a pivot band 7205/7250 and Friday’s rebound off 7250 has allowed a mini uptrend channel of the past month to continue to build. Momentum indicators remain stuck in a ranging configuration with RSI under 60 and MACD lines struggling to get over neutral. How the market reacts to Friday’s strong bull candle will be key now. Can some traction begin to build from this support at 7250? The resistance at 7347 (October high) needs to be breached before the 7440 resistance can be eyed. The bulls will point to the hourly RSI again bouncing off 40 whilst hourly MACD and hourly Stochastics pull buy signals. Today’s session could be crucial as to whether this is another damp squib or not.
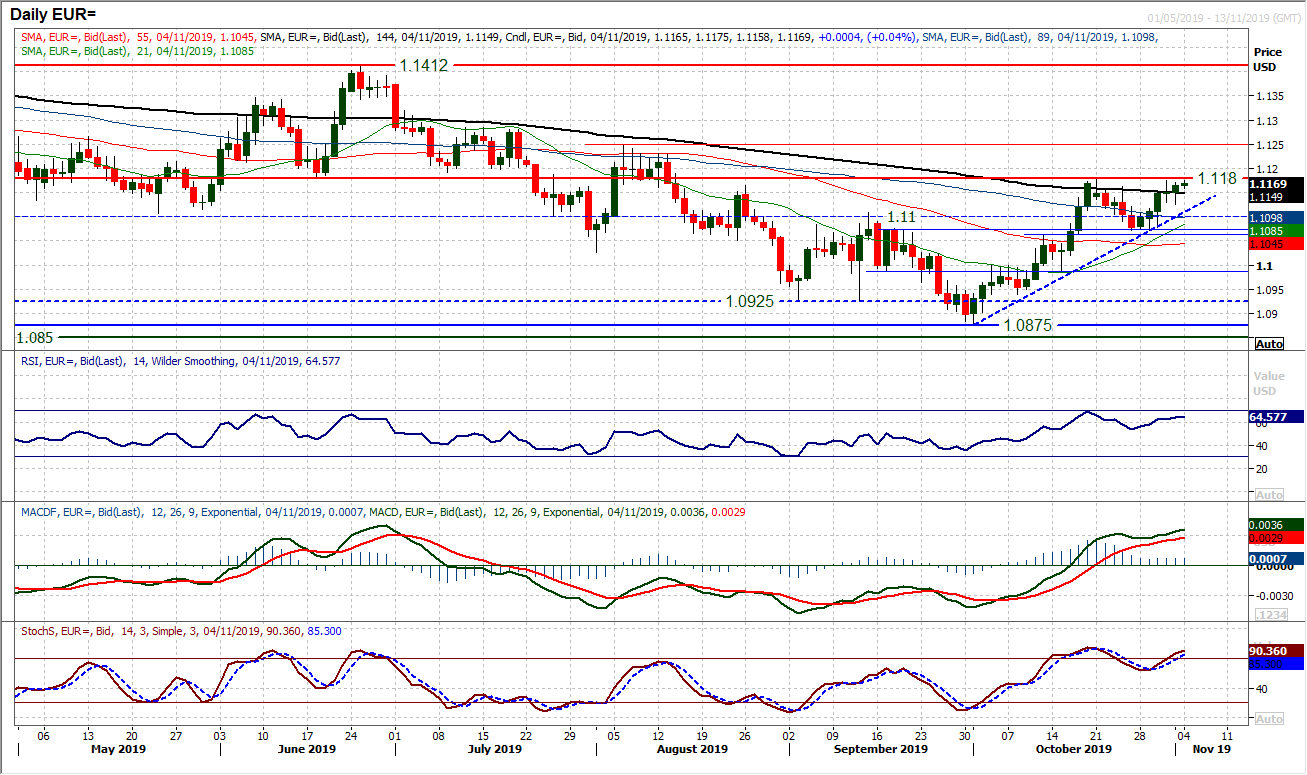
The euro continues to build higher. There have been some intraday questions asked of the bulls in recent sessions, but they seem content to continue to buy into weakness. After a bit of US data volatility on Friday, there was a solid reaction into the close to finish the week with the bulls eyeing a test of the next important resistance at $1.1180. The momentum indicators are strong and configured to suggest buying into weakness. The RSI is into the mid-60s, whilst MACD lines are rising solidly and Stochastics above 80. Our (slightly) re-drawn uptrend comes in at $1.1110 today and this is now building above the key breakout support area $1.1060/$1.1100. The prospect of $1.1070 also becoming a key support (and potential higher low) is growing too. The hourly chart shows positive configuration across the indicators, with RSI holding above 35/40 and near term support building at $1.1125. Pressure is building for a test of $1.1180 this morning and a breakout opens the next key resistance at $1.1250.
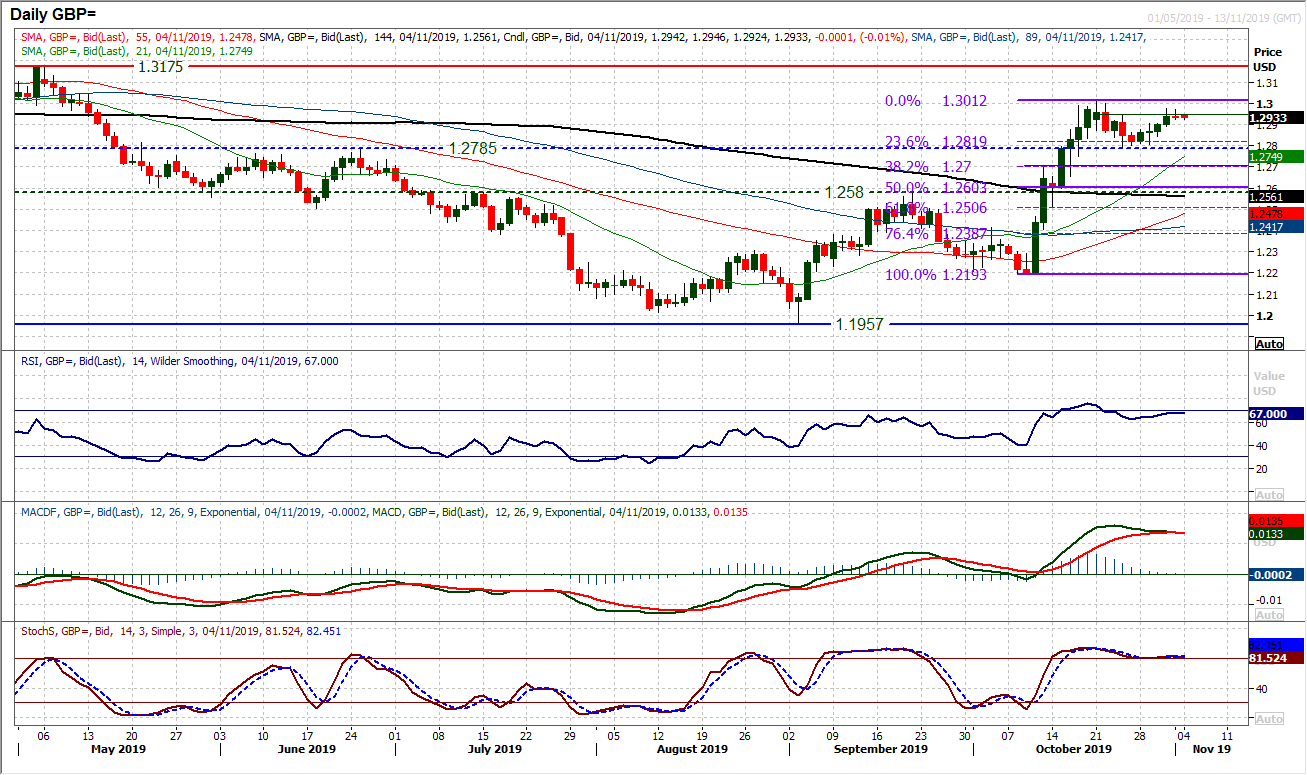
We see Cable will likely struggle for positive traction in the coming weeks. The fact that there was such a minimal candle on Friday with little direction into the close, we see as becoming increasingly commonplace now. Less than 50 pips of daily range on Payrolls Friday is like a balloon that has had the air taken out of it. A similar move is developing today. This comes as momentum begins to consolidate (albeit in strong positioning) with RSI, MACD and Stochastics all flattening off. Resistance is building up around $1.2975 just below the key $1.3000/$1.3010. The hourly chart shows a market just losing its fizz, with the hourly indicators all at or a shade under their neutral points. A move under $1.2920 would now also form a small 50 pip top and would suggest a drift back into the $1.2840/$1.2900 support band again.
The corrective forces through Dollar/Yen were held up a touch on Friday with mixed data points (positive payrolls but disappointing ISM Manufacturing). However, the breakdown below 108.25 has been an important move and means that the old support becoming overhead supply is restrictive to a recovery. A mild positive candle on Friday and a slight gain today is now testing this overhead supply. The momentum indicators posting near term corrective signals (bear crosses on Stochastics and MACD) adds pressure to a ten week uptrend (sits at 107.90 today). How the market responds to resistance between 108.25/108.50 will determine the near term outlook now. As hourly momentum signals become more negatively configured another failure around 60 on hourly RSI would be a negative signal. A close under 107.90 means that a retreat to the key medium term pivot band 106.50/106.75 would be likely. Above 108.50 and the bulls begin to flex their muscles a bit more.
Gold
Can the bulls break the growing near to medium term deadlock on gold which has seen the market broadly ranging between $1480/$1518 for the past month? An uncertain session on Friday (given the mixed data) did little to suggest that this was going to be the time that the gold bulls were able to break the shackles. Friday’s doji with a long lower shadow adds to the uncertainty. The bulls will point to the sensitive Stochastics pulling higher along with a mild positive bias beginning to show on the MACD lines, but it would need the RSI above 60 which would be the confirmation signal. It was interesting to see the $1500 support holding firm on Friday and the bulls are in a relatively encouraging position coming into today’s session. However we have been here before and the bulls have come up short. The hourly chart momentum indicators are rolling over as the European session takes hold. Only a decisive close above $1518 would suggest breakout. Under $1500 suggests $1480 comes back into focus.
WTI Oil
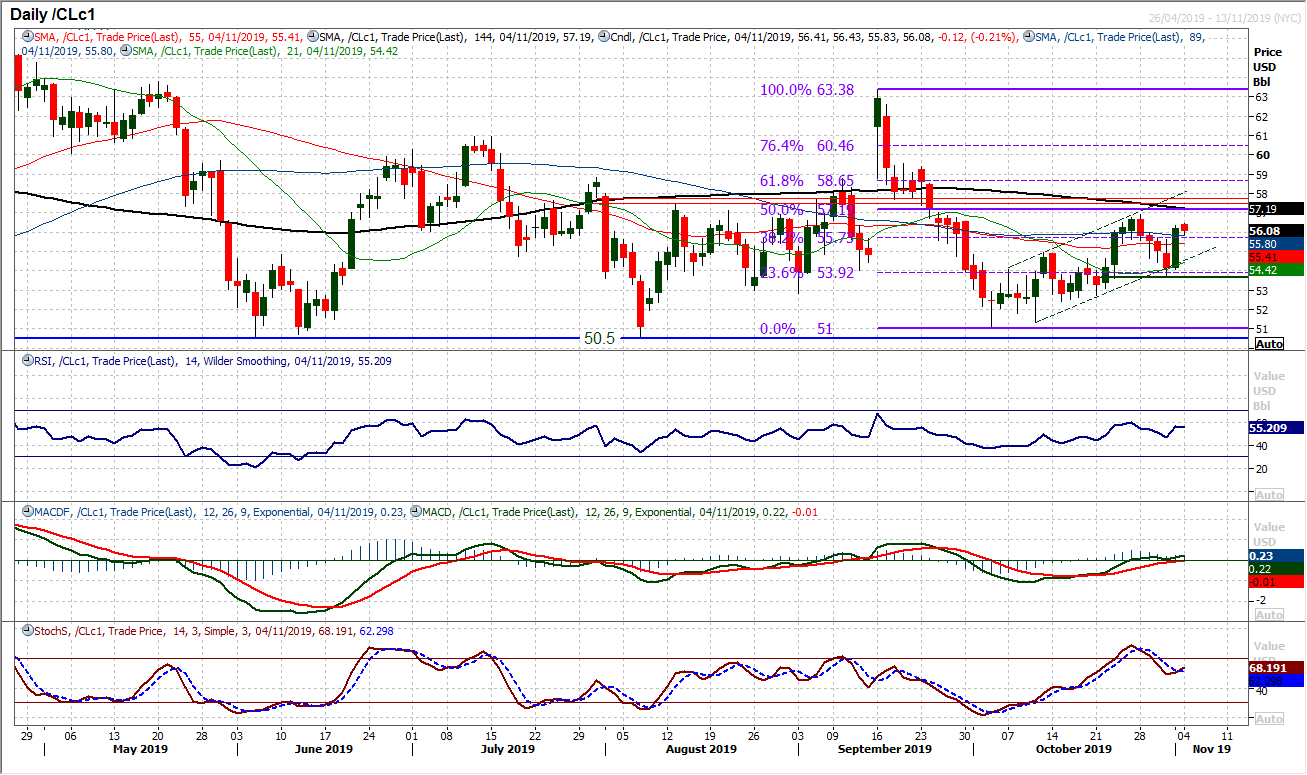
An incredible session adding over 3.5% on Friday has again shifted the complexion of this chart. The near term outlook is looking increasingly mixed and difficult to call, however, the bulls will be looking at the net impact on momentum indicators which is leading with a positive bias. MACD lines edging above neutral and Stochastics turning up around neutral add to this. However, essentially the RSI has spent the past few weeks oscillating between 40/60 which suggests ranging conditions. An early slip back today suggests a lack of traction following through to the new week. Resistance initially at $56.45 which is under the October high of $56.90. Initial support is $56.60/$56.70.
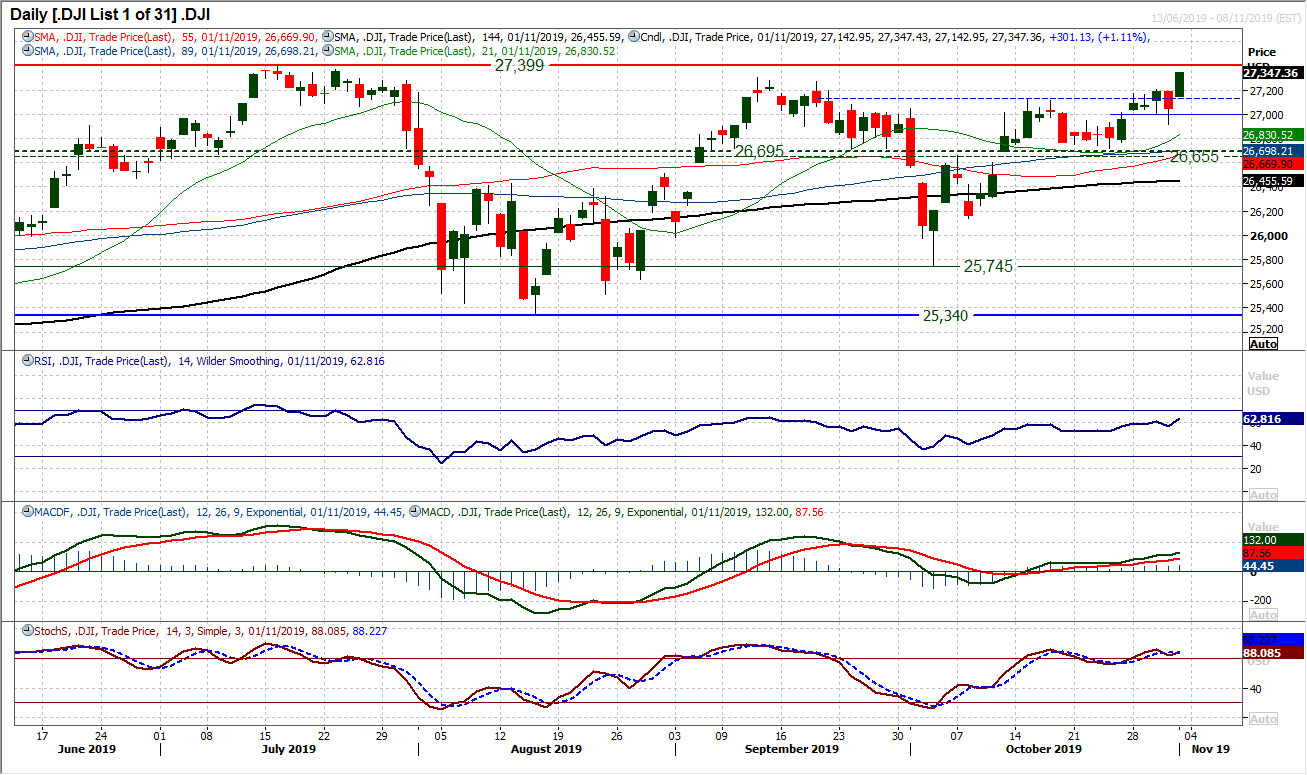
We continue to see corrections on the Dow as a chance to buy. The reaction of the bulls to Thursday’s negative session was impressive and decisive. Opening at the low and closing at the high (including a breakout above the key resistance of the September high at 27,306) was almost the perfect session. Momentum clearly remains very strong with this move, as the RSI moves decisively into the 60s, whilst MACD and Stochastics build on their strong configuration. The old breakout at 27,120 is now a basis of support but the bulls will be eyeing the all-time high of 27,399. Given the decisive force of Friday’s session, all-time highs should not be too onerous a task now.
"""DISCLAIMER: This report does not constitute personal investment advice, nor does it take into account the individual financial circumstances or objectives of the clients who receive it. All information and research produced by Hantec Markets is intended to be general in nature; it does not constitute a recommendation or offer for the purchase or sale of any financial instrument, nor should it be construed as such.
All of the views or suggestions within this report are those solely and exclusively of the author, and accurately reflect his personal views about any and all of the subject instruments and are presented to the best of the author’s knowledge. Any person relying on this report to undertake trading does so entirely at his/her own risk and Hantec Markets does not accept any liability. """
