I am sure I am not the only one who is wide-eyed at the strength of the stock market rallies over the previous six weeks or so. From the depths of the intense gloom surrounding markets in mid-October to the almost euphoric stance of the bulls today, the about-turn has been outstanding to say the least.
It has certainly caught me out despite knowing that second wave bear market rallies can be fierce.
But in the historic context over many decades, this sudden reversal is not a one-off by any means. In terms of the Dow, the recovery has come within 7% of its November 2021 ATH. And it could move even higher. But note that some second wave bear market rallies have come within 2-4% of their ATHs before embarking on major bear trends.
The key for my bearish case is that the Dow must not move above its 36,950 ATH otherwise the rally would not be a second wave bear market rally.
But in the Nasdaq and S&P, the recovery has been much tamer. The S&P has come within 16% of its ATH while the lagging Nasdaq has only managed to hit the 23% retrace of the move off its ATH.
And to get here, the bullish mania seems firmly entrenched with the bulls pinning their hopes on the Fed easing back on the 75 bps interest rate hikes. Of course, we know that they will just follow the market (more later).
So how is this state of bullish mania showing up in the data? First, here is Bloomberg’s take:
This optimism is showing up across a range of assets. A rush to corporate credit is favoring the riskier edges of the market, with junk bonds drawing their biggest passive inflows on record. Equity exposure among quants has turned positive and that of active fund managers is back near long-term averages. The inflation bid is crumbling, with the dollar heading for its steepest monthly decline since 2009 and benchmark Treasury yields down 30 basis points in November. Faith in the Fed restored, investors ended the week with the S&P 500 on course for a second monthly advance. Even Europe’s beleaguered equity index has gained for six consecutive weeks.
So junk bonds are back in favour are they? Let’s look at the technical picture:
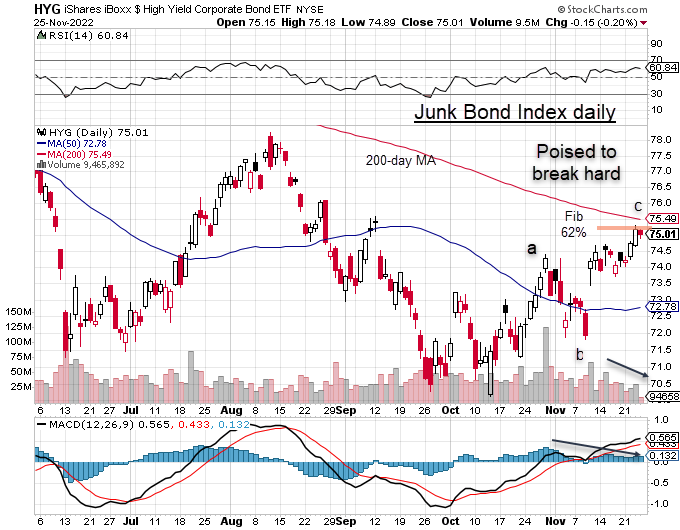
Recall that junk bonds trade like equities and as such made their major bear market low in mid-October and have been in a strong a-b-c rally since. But now they have reached the Fib 62% (as has the Dow) on a div in the MACD and a down-sloping volume histogram. They are also touching the down-sloping 200-day MA area.
Rarely have I seen such a textbook setup for a sudden reversal. This is the riskier end of the bond spectrum, how about the super-safe Long US Treasury Bond?
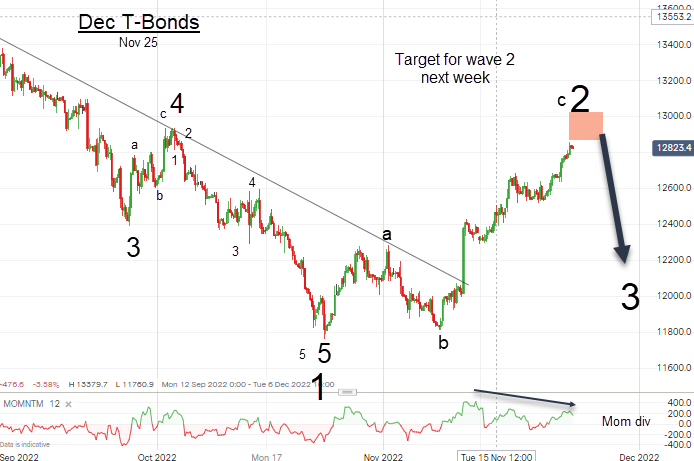
Yields topped out (wave 1 low in price) on 24 October and the rally has been in an a-b-c pattern (counter-trend). And late in the week, they hit my original target zone around the 129 print – on a good mom div. This was the chart I posted to VIP Traders Club members Friday morning.
Again, this looks very much like a textbook setup for a reversal in wave 3 down just as traders believe yields can only go down. The alternative count is that the rally is a three up of what will be a larger five up after a dip in wave 4.
Of course, much of the bullish fervour has been stoked by expectations that short term interest rates would continue falling and that inflationary pressures have been tamed. For evidence, crude oil prices have been under pressure with the US crude trading under the OPEC/Saudi line-in-the-sand $80 print.
Thus, it seems ‘obvious’ that there is no need for the Fed to ramp up rates by 75 bps at their December meeting. But as Joe Granville famously said: “When everyone believes something is obvious, it is obviously wrong”.
Over to equities and here is the chart showing the CNN Fear & Greed Index of the S&P
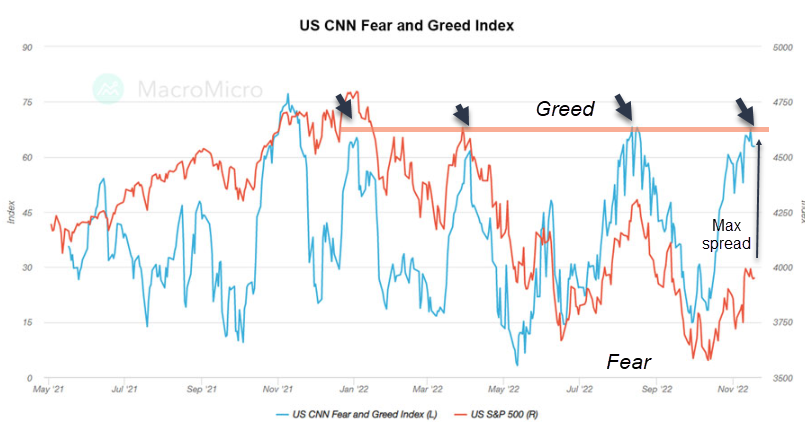
The Index (blue) has reached an extreme Greed reading from where previous reversals have started. Note the extreme spread with the S&P Index. It has taken the current extreme mania for shares to only reach these low levels in the S&P.
In other words, the bulls have used up all or most of their fire power to get the S&P only up to the Fib 38% retrace of the move off the October low! Could they possibly have anything left?
Of course, shares could move higher if the Fear & Greed Index gets even more manic. The Fed could suddenly announce a cancellation of its rate hikes (a pivot is already baked in), Putin could sue for peace, China could cancel its Covid lockdowns – and pigs might fly.
All of this bullish mania is appearing just as consumers are feeling the pinch with sentiment measures plumbing new lows. And now the US real estate market seems to be rolling over.
On Friday, I spotted MSM articles that proclaim that poor Black Friday retail sales data to emerge early next week would be good for shares (bad is good again).
Of course, a weak retail sales picture would confirm a weakening economy and with share valuations stretched, maybe it’s the turn for bad to be bad again. But what if sales have been stronger than expected? I have a feeling that would hit shares and bonds hard (the Fed will more likely keep to its 75 bps scheme).
Once again, Wall Street and Main Street are singing from totally different hymn sheets (what a discordant racket!)
A neutral observer should conclude that the odds favour at least a decent pause in the ascent that may or may not be terminal. To confirm the long and strong wave 3 has started, I need to see a small scale five down in stock indexes and the T-Bonds. But has this process already started in the Russell 2000? (see last week’s blog: Stocks are climbing its Everest)
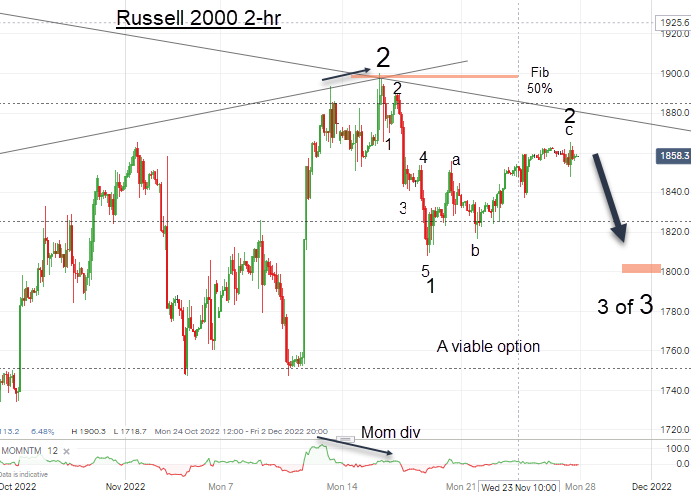
I have a likely five down in the 2-hr on Wednesday with the end of week rally in a three up. Provided the 1900 level holds, this will remain my top option. If it does, all is in place for a huge post-Thanksgiving break in all stock indexes and Treasuries going into the New Year. We shall see.
Yes, my twice-yearly Free Trial offer is now live and I am inviting you to take a two week Free Trial to my highly successful VIP Traders Club.
The dollar heads lower
I have been tracking the dollar lower for a while and it appears to be on track to move even lower short term.
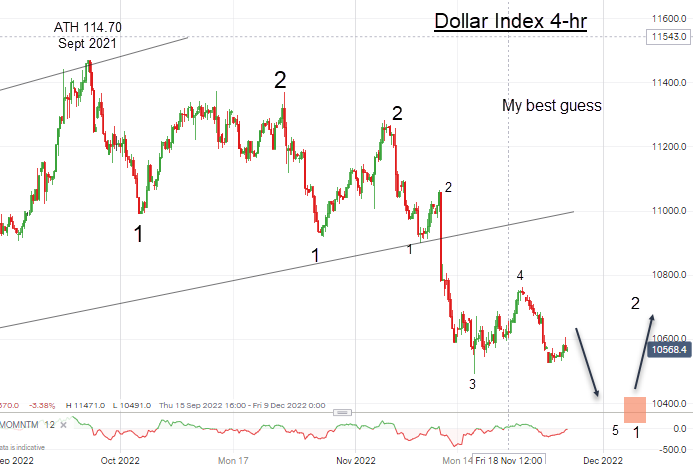
It appears to be in the final fifth wave of the latest wave 3 down with my target around the 104 area. But from there, we should see a major rally phase which I want to catch for members.
The consensus is for an even weaker dollar as the Fed is said to be poised to pivot and any more dovish noises emanating from that source should be the catalyst to reach my target. But then, I expect moves coming from the ECB to catalyse a dollar rally. Let’s see.
Are the oil majors vulnerable here?
Received wisdom is that investing in oil is a no-brainer for capital growth and especially income. The energy markets have been dominated by fossil for decades with over 80% of global energy consumption derived from those sources. This figure shows no signs of weakening as so-called ‘renewables’ have only made small inroads,
But has that story run its course? Last week I suggested that oil could be in a bear market. The big fight today is the competing forces of global production cuts and those of diminishing consumption as users cut back as household and industrial costs have soared.
Here is the BP (LON:BP) chart
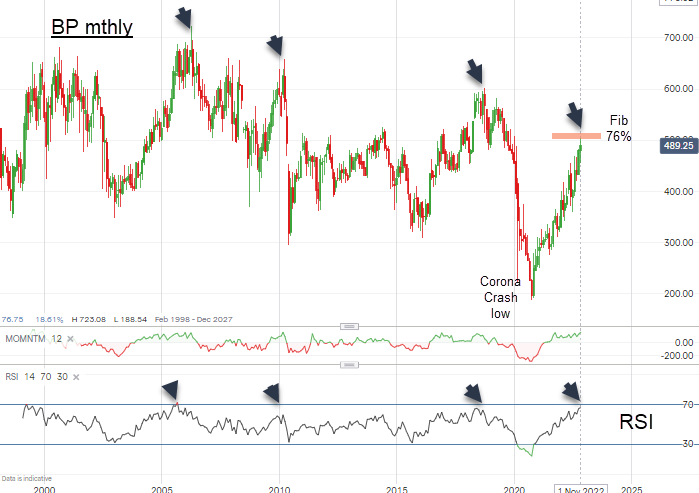
On long term charts, I like to review where the RSI (Relative Strength Index) lies. Note that when it approaches the upper 70 level, that is when tops are made – and today, RSI is pegged at the highest level since the 2006 high of £7.25. That certainly places today’s £4.90 print as a likely candidate for a top.
It has also reached the Fib 76% retrace of the previous wave down to the Corona Crash low (where some US producers were paying users to cart the stuff away as storage units were full to overflowing!).
Because the oil market is highly political and with OPEC having moved back to being the swing producer again (the US shale patch took that crown temporarily), I am unable to make any sensible forecast for the supply/demand balance into 2023.
And with the ongoing War on Fossil being waged by the virtue-signalling Western politicians (all the while begging for more oil), how can anyone make any rational sense of that?
I know BP has edged into renewables but it appears even there, the pressure to reduce their massive taxpayer subsidies is building and that sector should become less profitable.
With all of these uncertainties and with valuations appearing very stretched, taking at least some profits would be a prudent move.
