GBP/USD Is Facing Major Support Trend Line

Published 16/08/2017, 08:24

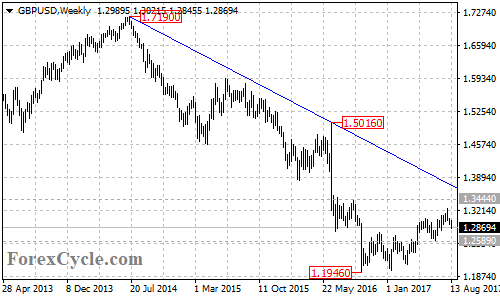
GBP/USD pulled back from the August 3 high of 1.3267 and dropped sharply to 1.2845 area after failing in its attempt to break above 1.3444 resistance.
GBP/USD Weekly Chart

On the upside

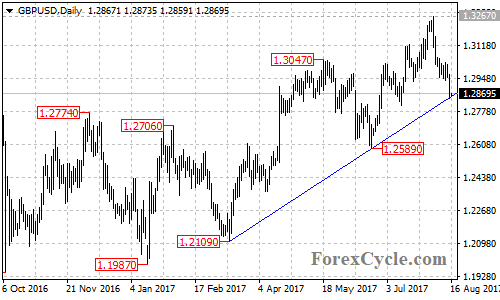
The GBP/USD pair is now facing the support of the major bullish trend line from 1.2109 to 1.2589 on its daily chart. As long as the price is above the trend line, the fall from 1.3267 could be treated as consolidation of the bullish movement from 1.1987 and another rise to retest 1.3444 resistance could be expected after the consolidation.
GBP/USD Daily Chart

Near term resistance levels are at 1.2930 and 1.3030
, above these levels will suggest that the uptrend has resumed, then next target would be at 1.3267 previous high, followed by 1.3444 resistance.

On the downside

A clear break below the bullish trend line on the daily chart could take price to test 1.2589 key support, below this level will confirm that the upside movement from 1.1987 had completed at 1.3267 already, then the following downside movement could bring price back to retest 1.1946 support.

For long term analysis

GBPUSD is below the long term bearish trend line from the July 2014 high of 1.7190 to the June 2016 high of 1.5016, now at around 1.3725. As long as the pair is below the trend line, the bounce from the October 2016 low of 1.1946 could be treated as consolidation of the long term downtrend from 1.7190, and a breakdown below 1.1946 support could signal resumption of the downtrend.

Technical levels

Support levels: 1.2845 (the bullish trend line on the daily chart), 1.2589 (the June 21 low, key support), 1.2109 (the March 14 low), 1.1946 (the October 2016 low).

Resistance levels: 1.2930 and 1.3030 (near term support), 1.3267 (the August 3 high), 1.3444 (the September 2016 high), 1.3725 (the trend line on the weekly chart).

Latest comments

Loading next article…
Risk Disclosure: Trading in financial instruments and/or cryptocurrencies involves high risks including the risk of losing some, or all, of your investment amount, and may not be suitable for all investors. Prices of cryptocurrencies are extremely volatile and may be affected by external factors such as financial, regulatory or political events. Trading on margin increases the financial risks.
Before deciding to trade in financial instrument or cryptocurrencies you should be fully informed of the risks and costs associated with trading the financial markets, carefully consider your investment objectives, level of experience, and risk appetite, and seek professional advice where needed.
Fusion Media would like to remind you that the data contained in this website is not necessarily real-time nor accurate. The data and prices on the website are not necessarily provided by any market or exchange, but may be provided by market makers, and so prices may not be accurate and may differ from the actual price at any given market, meaning prices are indicative and not appropriate for trading purposes. Fusion Media and any provider of the data contained in this website will not accept liability for any loss or damage as a result of your trading, or your reliance on the information contained within this website.
It is prohibited to use, store, reproduce, display, modify, transmit or distribute the data contained in this website without the explicit prior written permission of Fusion Media and/or the data provider. All intellectual property rights are reserved by the providers and/or the exchange providing the data contained in this website.
Fusion Media may be compensated by the advertisers that appear on the website, based on your interaction with the advertisements or advertisers.
© 2007-2025 - Fusion Media Limited. All Rights Reserved.