by Clement Thibault
For oil traders 2016 was an overly full year, rife with opportunity, uncertainty and even some market chaos. With the price of oil ranging from $26 to $55, avid traders had ample room to take advantage of—or be taken advantage of by—the situation and the lack of clarity. OPEC was active as well, trying repeatedly, and eventually successfully, to negotiate a production cut that would be adhered to by both cartel members and non-OPEC countries.
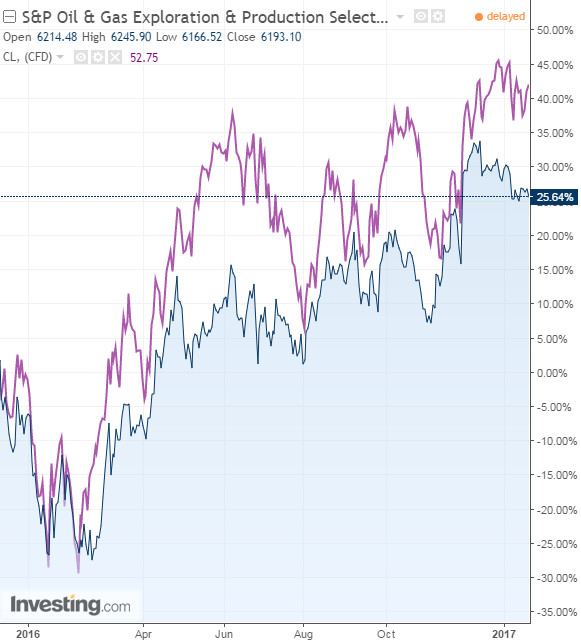
Oil price moves are often broadly reflected in the stock market across a wide range of sectors. But for oil and gas companies the impact has obviously been much more severe. The S&P Oil & Gas Exploration & Production Select Industry Index has almost perfectly mirrored crude oil price fluctuations in 2016.

Exxon (NYSE:XOM) and Chevron (NYSE:CVX), two of the world's biggest integrated oil and gas companies, were also affected by the recent oil crisis which has pulled each of their share prices down. But now that the price of oil appears to be on steadier footing, oil and gas majors are a more reliable investment. Which company, then, is the better play?

Chevron reports earnings on Friday, January 27 before the market opens, and Wall Street expects it to post an EPS of $0.63 on $32.6 billion in revenue.

ExxonMobil will report on Tuesday January 31, before the open, and is expected to report EPS of $0.71 on $60.6 billion revenue.
1. The Businesses
Both Exxon and Chevron operate globally, with drilling platforms and refineries situated all over the world. Exxon and Chevron, like many companies in the sector, divide their income streams into two separate segments: Upstream, under which exploration and drilling operations are classified, and Downstream, which includes refineries and marketing of the actual product. Exxon also has significant revenue from a third segment that Chevron lacks, chemicals operations.
Both company's earnings have taken a beating over the past nine months. Exxon's Upstream earnings have dwindled from $6.2 billion in the first nine months of 2015 to just $838 million over the first nine months of 2016. Downstream earnings have suffered too, falling from $5.2 billion to just over $3 billion. Exxon's chemicals division, however, which refines and produces petrochemicals for a variety of industries, grew from $3.4 billion to $3.7 billion.
Chevron has done worse. Its Upstream earnings went from a loss of $600 million over the first nine months of 2015 to a staggering loss of $3.4 billion over the first nine months of 2017; CVX's Downstream earnings mirrored the similar decline in Exxon's segment: $6.5 billion to just over $3 billion over the past nine months.
Chevron's overall earnings are now negative. All of Exxon's divisions remain profitable.
2. Proven Reserves
Each company's most recent end-of-year reserves report (released at the beginning of 2016) showed that Exxon had 24.8 billion BOE (barrels of oil equivalent), while Chevron had 11.2 BOE. Taking into account the number of shares outstanding for each stock, calculations show that both companies have 5.9 BOE/Share of proven reserves.
However, while Chevron took a $2.6 billion write-down in Q2 2016—something many oil companies did following the downturn in crude prices—Exxon hasn't yet taken any write-downs. The fact that Exxon didn't recorded any write-downs thus far is peculiar. So much so that the SEC has opened a probe into Exxon's decision. As a result, Exxon could de-book some 4.6 billion barrels from its assets, hurting its BOE/Share to a point at which it would trail Chevron. These write-downs will make for an interesting end-of-year report for both companies.
3. Levels of Debt
Since the oil and gas sector is capital intensive, requiring billions in expenditures for exploration and extraction, highly leveraged companies can go bankrupt in the face of a sharp drop in company revenues and earnings. And because the industry's revenues and earnings are severely affected by volatile oil prices this metric is twice as important when evaluating companies operating in the oil and gas sector.
Exxon has $46 billion of debt, while Chevron's debt totals $45 billion. However, Exxon's situation is actually better: it is the larger of the two companies with a $352 billion market cap, versus Chevron's $219 billion valuation. These numbers help to better comprehend the debt figure via two ratios: Debt-to-Equity and Debt-to-EBITDA (earnings before interest, taxes, depreciation and amortization).
Debt-to- Equity shows that the company is not relying excessively on debt relative to the value of their shareholder equity. Exxon has a ratio of 0.271, while Chevron has a slightly higher ratio of 0.310. Both are reasonable.
Looking at Debt-to-EBIDTA measures the company's ability to repay the debt. Once again Exxon leads by a wider margin with a ratio of 1.4 to Chevron's 2.6, which indicates that Chevron is leveraged twice as much as Exxon. However, Chevron's 2.6 ratio isn't considered excessive or dangerous.
4. Profitability
Almost every single widely used profitability metric points to the same conclusion: Exxon is, overall, a more efficient and more profitable company. Return on equity? Exxon leads with 5.2% over Chevron's -1%. Return on invested capital? 4.1% for Exxon, compared to -0.78% for Chevron. Return on assets? 2.63% versus -0.57%, once again in Exxon's favor. It's been like this for the past ten years – Exxon has historically almost always shown better returns than Chevron.
As for margins, until June 2015, Chevron actually led Exxon for the major part of the last decade. But low oil prices took their toll on Chevron's TTM margins. Since the end of 2014, CVX went from an operating margin of 14.7% to -5.8%, and from a profit margin of 8.9% to -1.34%. Over the same timeframe XOM's operating and profit margins shrunk from 12.5% to 4.5% and from 7.8% to 3.9% respectively.
Conclusion
Both companies are very stable. They're two of the largest players in the industry, with good reason. Their managements are capable, opportunities are often seized through strategic acquisition, and there are no immediate red flags to worry about. Both companies value their dividend programs and offer relatively attractive yields (3.7% for CVX, 3.5% for XOM).
On paper, Exxon appears to be the safer and better choice. There's just one problem – share appreciation.
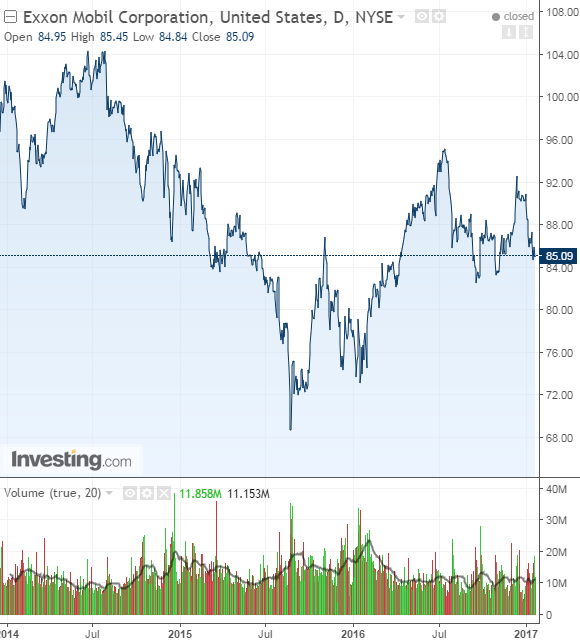
Exxon has been trading in the $80 to $90 per share range for almost a decade. While the company has had its ups and downs, providing good returns for those who took advantage of the volatility, buy-and-hold stakeholders haven't been properly rewarded for the past ten years. The share price seldom pushed beyond $95, and when it did it never held at that level for longer than a few months.
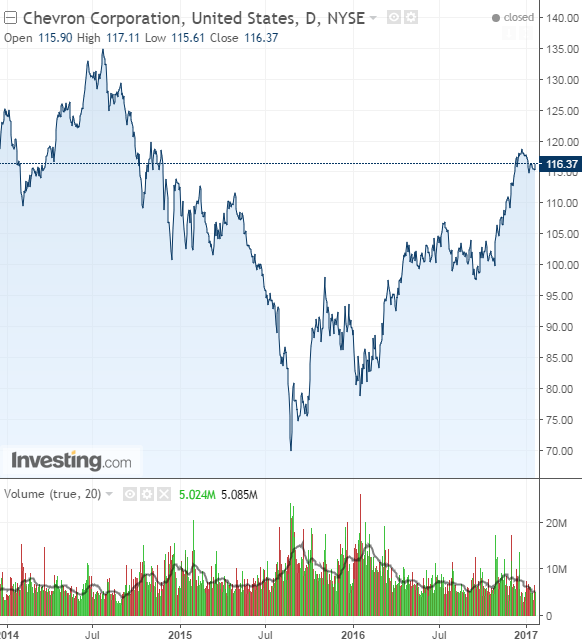
Chevron has better prospects in this regard, and has also had a faster recovery from the oil price collapse due to its more focused business model. Because it lacks a big chemicals operation like Exxon's it has less to anchor it down when the price of oil rises. Exxon may have performed better than Chevron when oil prices were at their lowest, but the almost over-diversification of Exxon prevents it from achieving considerable growth.
We believe that as oil prices begin to recover, Chevron will head higher. Exxon may be the safer play, but given recent commodity market conditions and the way the equity market loves pricing stocks according to potential growth, Chevron might just be the better investment.
